Building a Native Executive Sales Dashboard in GoHighLevel
Every morning a sales leader wants three answers before the coffee cools: are we busy, is the pipeline growing, is money coming in. Here is how we built one leader a clean GoHighLevel sales dashboard, right inside the CRM, that gives all three in under 60 seconds.
- The three questions a real executive dashboard has to answer
- How to keep a reporting project from turning into a surprise-invoice mess
- Why a code-built dashboard is cheaper to rebuild and move than a hand-dragged one
- The sales metrics GoHighLevel does and does not track natively
- Why you prove a dashboard with seeded data before it reaches the client
A national sales-training client came to us frustrated. Every number they needed was in the CRM somewhere, but getting a straight answer meant clicking through five different reports before the first meeting. What they wanted was simple: one dashboard that answers three questions in under 60 seconds every morning.
- Are we doing the activity?
- Is the pipeline growing?
- Are we closing business and collecting cash?
An executive sales dashboard is a single glanceable scorecard that shows a sales leader three things at once: team activity, pipeline health, and closed revenue with cash collected. Inside GoHighLevel it lives native to the CRM, so there is nothing extra to log into.
Three questions, three sections
Not a complicated CRM report. A clean scorecard the leader can use to coach the team and run the business at a glance. The catch: they wanted it native inside their CRM, which is GoHighLevel, so they own it, there is nothing extra to log into, and nothing extra to maintain. (If you would rather wire one up yourself, our guide to setting up GoHighLevel dashboards walks through the manual version.)
Here is exactly how we built it, and the principles that made it ship clean.
Step One: Verify Every Data Source in GoHighLevel Before You Promise
Before quoting a single hour, we verified that every data source actually lived in the CRM. This is the step most people skip, and it is the one that saves the project.
The good news: calls, with recordings, talk time and duration by rep, plus outbound emails, appointments, opportunities and invoices, were all already flowing inside GoHighLevel. No new integrations required. This was a build, not a plumbing project.
Being honest about the gaps mattered just as much. A few things the platform simply does not do natively: forecast versus quota, deal aging by stage, average sales cycle, and per-rep outbound email counts. Naming those up front builds trust. Nobody likes surprises after the invoice.
Verify every data source before you quote. Confirming what already lives in the platform, and saying plainly what does not, is the difference between a build and a plumbing project.
Step Two: Build the GoHighLevel Dashboard From Code, Not By Dragging Widgets
Rather than hand-drag two dozen widgets, we built the whole dashboard with code, with AI doing the heavy lifting. That means it is repeatable: the same build moves from a test copy to the live account in minutes, and rebuilds cleanly if anything changes.
The finished board maps straight to the three questions.
- Outbound calls
- Live conversations
- Voicemails
- Talk time and average call length
- Appointments booked and held
- Calls-by-rep leaderboard
- Total pipeline value
- Deals and dollars added
- Average deal size
- Pipeline by stage (count and value)
- Pipeline-by-rep leaderboard
- Closed won
- Deals won and lost
- Cash collected, month and year to date
- Invoices paid
- Pipeline trend line
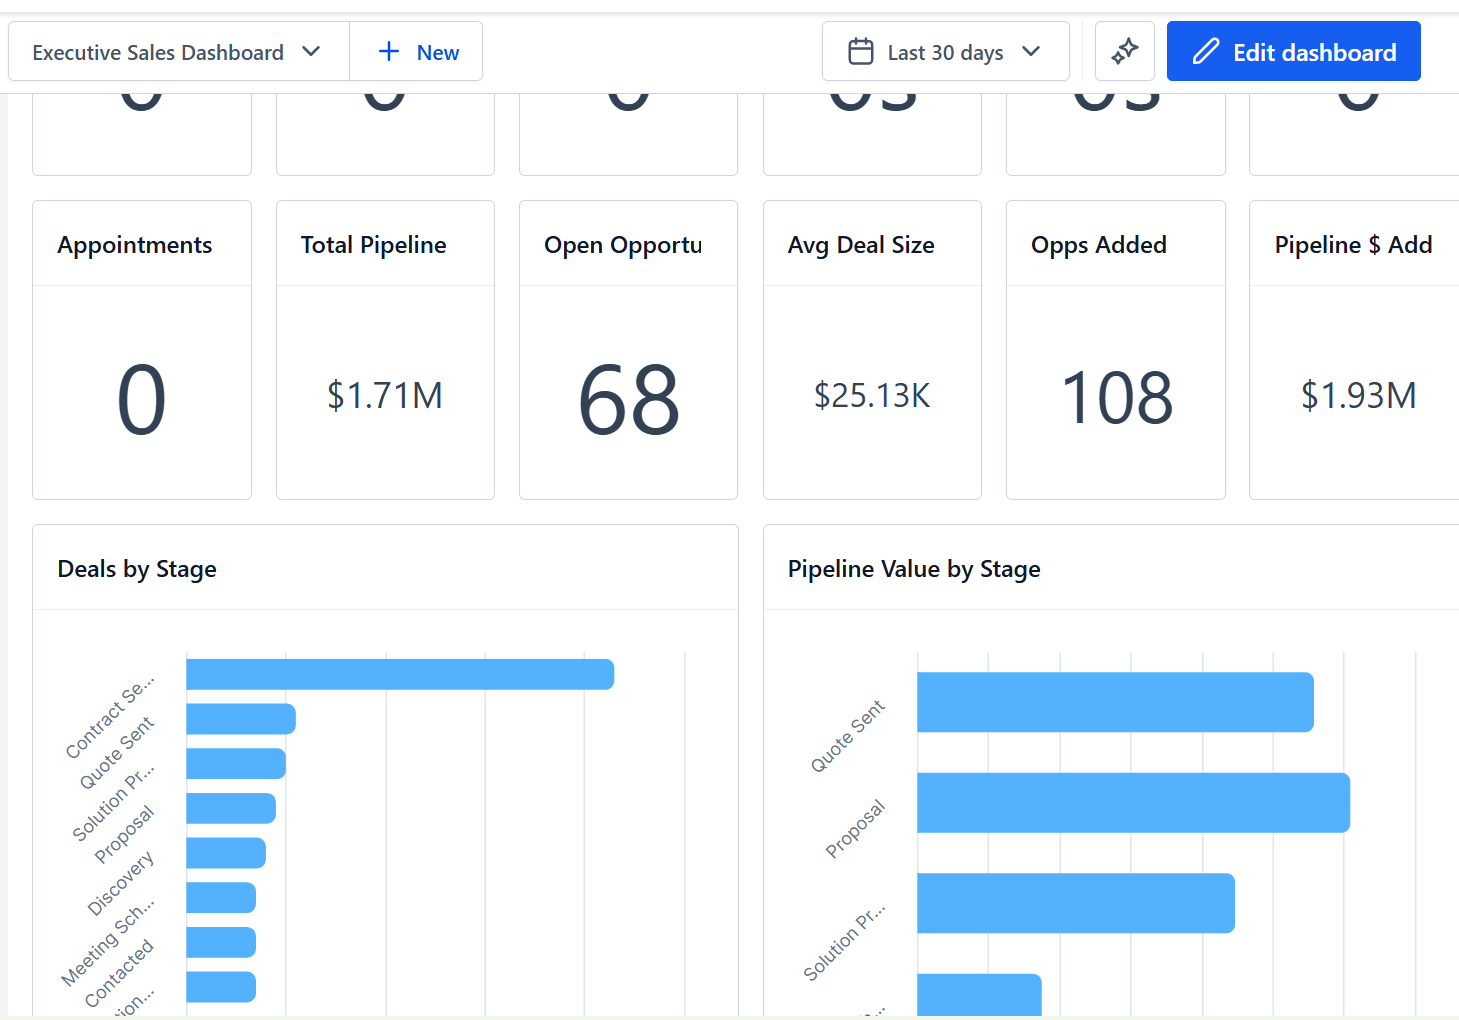
Plus a small alerts layer for the deals that need attention: large open deals, and new high-value opportunities. The leader sees the few things worth acting on today without hunting for them.
Step Three: Prove the Sales Dashboard With Real-Looking Data
A dashboard full of zeros tells you nothing. We seeded a test copy with sample deals across every stage, open, won and lost, so the leader could see the funnel light up: pipeline value, stage-by-stage breakdowns, win and loss, average deal size and the trend line, all populated and moving.
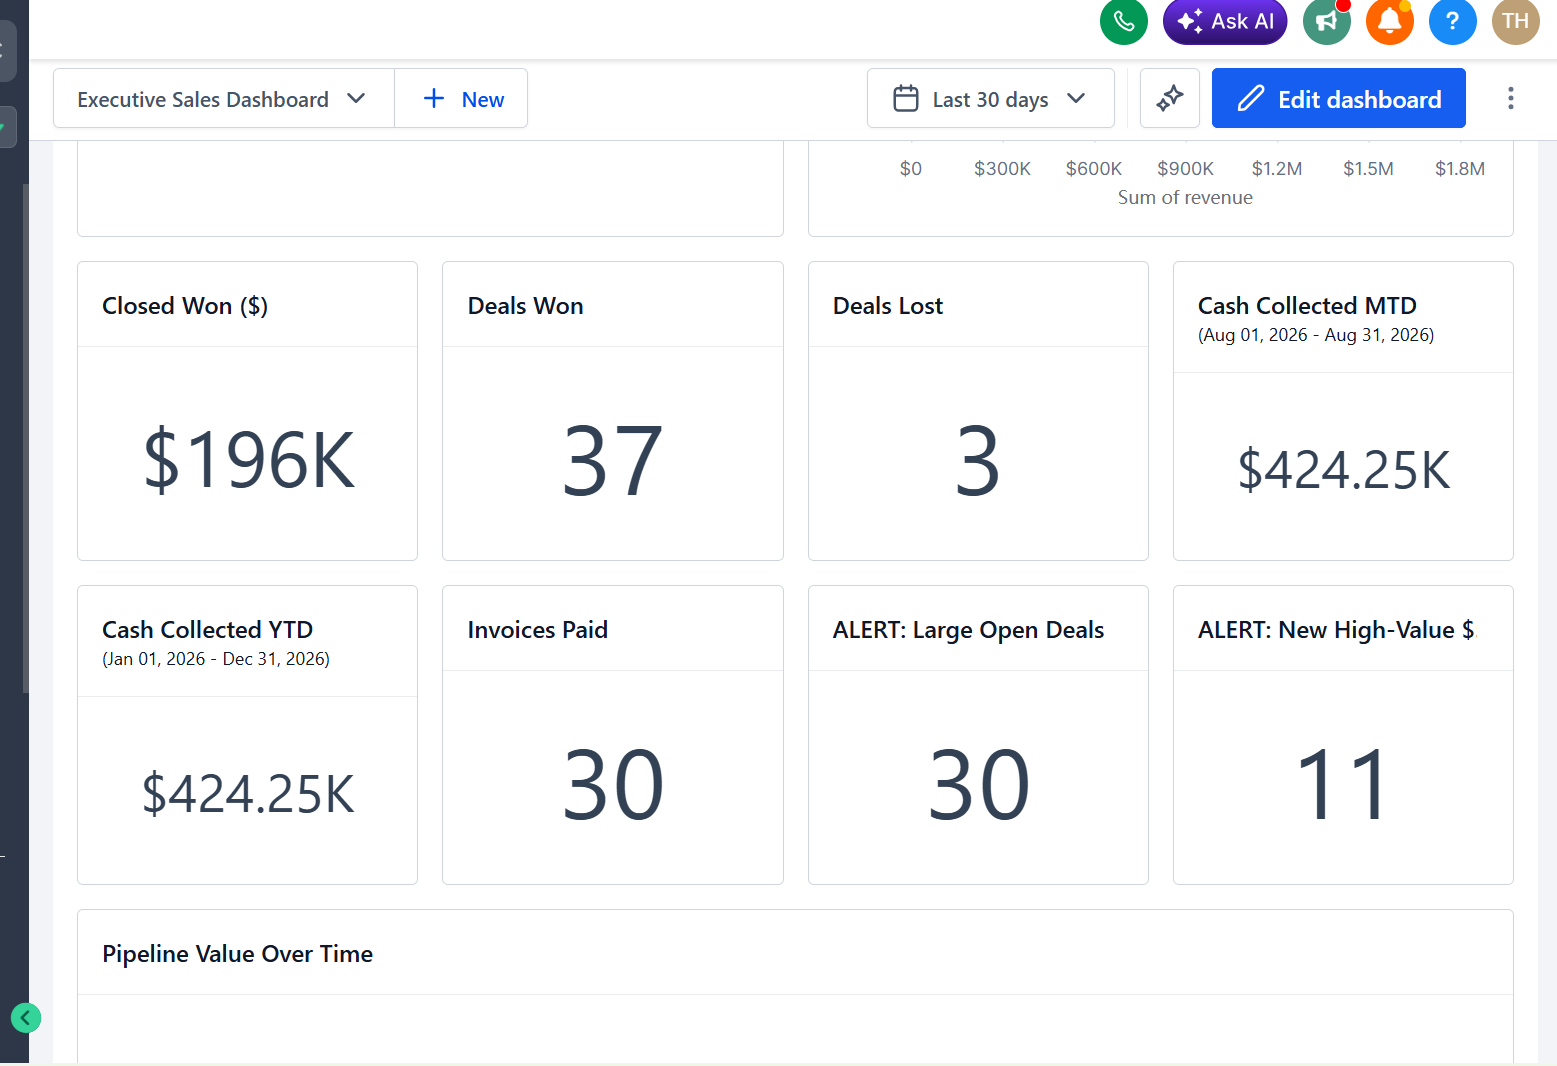
Proving it with data before it ever reaches the client's screen does two things. It surfaces any gaps in the build while there is still time to fix them, and it lets the leader react to a real-feeling board instead of imagining one. Feedback on something you can see is always better than feedback on a description.
The Lesson
The objective was never a fancy report. It was a clean morning check that tells a sales leader whether the team is doing the activity, whether the pipeline is getting healthier, and whether that activity is turning into revenue and cash.
The method is the part worth stealing:
- Verify first. Confirm every number already lives in the platform before you promise anything.
- Be honest about what the tools can and cannot do.
- Build it so it is repeatable. Code beats dragging widgets when you want to rebuild or re-point it later.
- Prove it with data before it ever reaches the client's screen.
That is how you ship a dashboard a leader will actually open every day. And by building it with code instead of by hand, the kind of build that used to take 15+ hours of manual work now comes together in under half a day, which means the reporting that used to be too expensive to justify is finally within reach for a normal-sized business.
Done For You
Want this exact dashboard inside your CRM?
We build native executive dashboards inside GoHighLevel: activity, pipeline, and results in one glanceable board you own, with nothing extra to log into. Verified sources, repeatable build, proven with data before it goes live.
Book a 15-Minute Call → or see what else we set upExecutive Sales Dashboard FAQ
What should an executive sales dashboard actually show?
A good executive dashboard answers three questions in under a minute: are we doing the activity, is the pipeline growing, and are we closing business and collecting cash. Everything on the board should map to one of those three. Anything that does not is a vanity metric that gets in the way of a fast morning read.
Can you build a sales dashboard natively inside GoHighLevel?
Yes. Calls with recordings and talk time, outbound emails, appointments, opportunities and invoices already flow inside GoHighLevel, so an executive scorecard can be built native to the CRM with nothing extra to log into. We build it with code, so it is repeatable and moves from a test copy to a live account in minutes.
What sales metrics does GoHighLevel not report on natively?
A few things the platform does not calculate natively: forecast versus quota, deal aging by stage, average sales cycle length, and per-rep outbound email counts. Naming those limits up front, before quoting the work, keeps the project honest and avoids surprises after the invoice.